 Human beings possess the ability to deal with geographic detail at
widely varying levels of detail. They can flexibly work with
geographic facts at the global level and the local level. Most
people, if pressed, can draw a rough map of the country in which they
reside and show where it stands with relationship to other countries.
Most people can draw a rough approximation of the other entities that
they live in as well: states or provinces, counties, townships,
parishes, cities, neighborhoods, and streets. Each individual knows
the geographic details and relationships that are pertinent to
them.
Human beings possess the ability to deal with geographic detail at
widely varying levels of detail. They can flexibly work with
geographic facts at the global level and the local level. Most
people, if pressed, can draw a rough map of the country in which they
reside and show where it stands with relationship to other countries.
Most people can draw a rough approximation of the other entities that
they live in as well: states or provinces, counties, townships,
parishes, cities, neighborhoods, and streets. Each individual knows
the geographic details and relationships that are pertinent to
them.
The long term goal of this research is to create artificial research agents that understand geographic relationships in a fashion similar to human beings. A key part of this research is investigating data structures for representing geographical shapes. The data structures must be compact, allow multiple levels of detail, and be flexible in adding or removing detail.
Background
Quadtrees
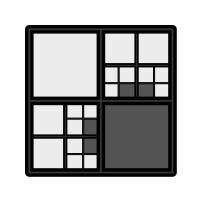
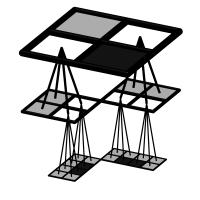 Quadtrees are a well established technique in computer graphics and
computer vision for representing 2D shape. A quadtree is a tree data
structure with each tree node having up to 4 children. A quadtree
node usually represents a square which can be subdivided into 4 other
squares which cover the same area. Each leaf node is marked as being
part of the object or not.
Quadtrees are a well established technique in computer graphics and
computer vision for representing 2D shape. A quadtree is a tree data
structure with each tree node having up to 4 children. A quadtree
node usually represents a square which can be subdivided into 4 other
squares which cover the same area. Each leaf node is marked as being
part of the object or not.
Advantages of quadtrees include
- multiple levels of detail, with easy conversion from high resolution levels to low resolution. Simply truncate branches of the tree.
- simultaneous mixed level of detail possible.
- vastly different representations when objects undergo translation or rotation.
- difficulty in recognizing and comparing similar shapes
Chain codes
Chain codes represent the shape of a 2D object as a sequence of vectors taken from a small set of representative vectors. Advantages of chain codes include
- high compression ratios.
- immune to change under translation.
- no multiple levels of detail. Conversion from high resolution to low resolution is seldom unique.
- no simultaneous mixed level of detail.
- different representaion under rotation.
Analysis
For geographic shapes, translation and rotation can be largely ignored. These operations occur mostly in the context of recognition problems. In geographic settings the main questions are those of relationship. Consequently, the research presented here is based on quadtrees with their strength of multi-resolutional representation.
Octahedral Quadtrees
When squares are used to represent the surface of the earth, distortion unavoidably occurs when approaching the poles. But squares are not the only shape that can be subdivided into similar forms. Triangles can also be subdivided into four smaller triangles, making triangular quadtrees possible. Coupled with one of the triangular platonic solids (tetrahedron, octahedron, or icosahedron) as an initial approximation and projected onto the surface of the earth, triangular quadtrees can be used to represent shapes on the earth's surface.
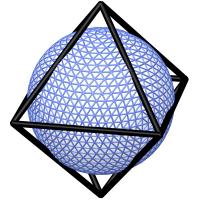 The octahedron is particularly well suited for geographic
representations because the triangular subdivision scheme sets up
edges that are roughly parallel to terrestrial latitude lines.
The octahedron is particularly well suited for geographic
representations because the triangular subdivision scheme sets up
edges that are roughly parallel to terrestrial latitude lines.
Results
Mesh Creation
Software has been created to create octahedral quadtree meshes from collections of line segments describing geographical boundaries. Standard polygon scan conversion routines have been modified to output directly into a quadtree rather than into a bitmap which would be too large to fit into memory at the fine resolutions used.
Each node in the quadtree has one of four possible values. The area covered by each node can be either
- in the region
- out of the region
- partially in/out of the region
- not a leaf node, i.e., check with the children.
Work is currently underway to convert all of the geographic areas found in the Tiger/Line data set available from the U.S. Census Bureau. The scan conversion is being done to a resolution of approximately 10 meters.
Storage
The geographic regions are stored by following a level order traversal of the quadtree. The traversal does not need to store linkage information, so two bits per node is all that is needed to preserve the label.
The level order traversal also allows easy data simplification. The data stream can be truncated at any point and still remain a valid, lower resolution shape representation (after tweaking some former parent nodes to be leaf nodes with partial membership values).
Manipulation
Programs have been created for performing logical intersection, union, and negation on region.
Visualization
Although visualization is not the goal of this research, an interactive region viewing program has been created to help evaluate correctness. The program allows interactive scrolling and scaling and owes its speed to the fact that it only needs a small portion of the quadtree to draw any given view.
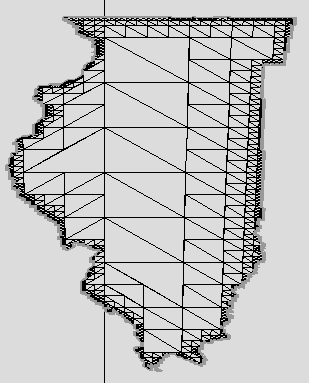
 This animation demonstrates a 1,000,000:1 zoom centered on an
interesting point on the boundary of the state of Illinois. At the
outermost level, the horizontal lines, from top to bottom, represent
the north pole, equator, and south pole of the Earth. At the smallest
level, the triangles shown are approximately 10m in size.
This animation demonstrates a 1,000,000:1 zoom centered on an
interesting point on the boundary of the state of Illinois. At the
outermost level, the horizontal lines, from top to bottom, represent
the north pole, equator, and south pole of the Earth. At the smallest
level, the triangles shown are approximately 10m in size.
The animation shown is much slower than the real-time zoom rates experienced in the display software used. In this animation no more than 2929 nodes were used out of 1142920 at any given time.
In the animation, a slight popping can be seen when the data resolution used changes by a factor of 2. The data structure shown represents the entire state boundary of Illinois at 10m resolution and takes ~285kB of storage in its compressed form. In main memory, it takes ~35MB.
(Some people have asked if the expansion point in this animation has any particular significance. No, it was chosen arbitrarily as an area of nice fine-feature detail. In real life, it's a point in the middle of the Ohio River between Hardin County, Illinois and Crittenden County, Kentucky.)
Future Research
Future directions includeHierarchical rendering - Most of the time in scan converting the large polygon representing a geographic shape into a quadtree is spent on maintaining the quadtree. Large internal triangles start out as small triangles on the scan line which are eventually coalesced into the large one. A lot of time is spent on creating small nodes and combining them.
A faster approach would be to render the shape first at low resolution and then render it again at high resolution. The large internal triangles would already exist and the computational effort would be spent on the fine details.
Temporal extensions - Representing geographical shapes over time would enable a search agent to answer spatiotemporal queries in addition to geographical queries.
Operations on compressed forms - The comprssed data structures expand by a factor of 100 in memory due to explicit node pointers. Can logical and morphological operations be performed directly on the compressed structures? Preliminary experiments say yes.